Cyclic Voltammetry Basic Principles and Theory

Cyclic voltammetry is an electrochemical technique used to measure the current response of a redox active solution to a linearly cycled potential sweep using a potentiostat. It is a useful method if you need to quickly find information about the thermodynamics of redox processes, the energy levels of the analyte and the kinetics of electronic-transfer reactions. This is important in the characterization of conductive polymers, battery materials, supercapacitors, and fuel cell components.
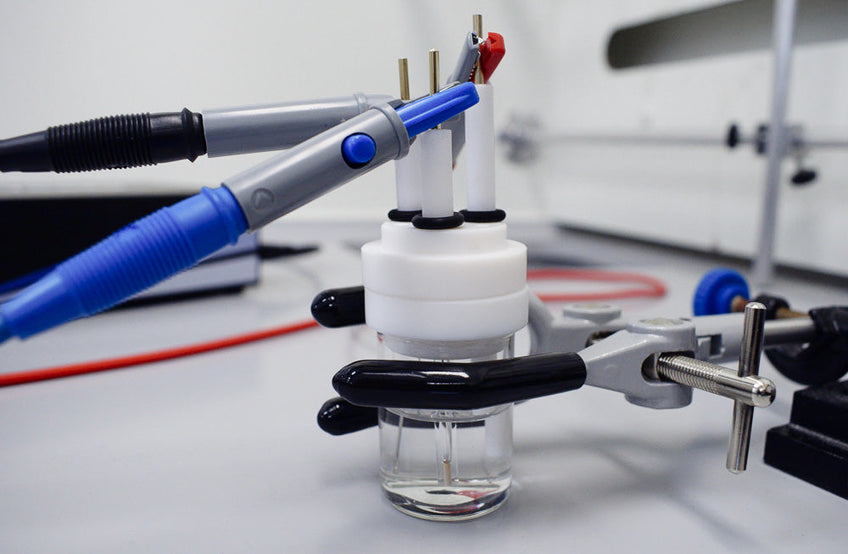
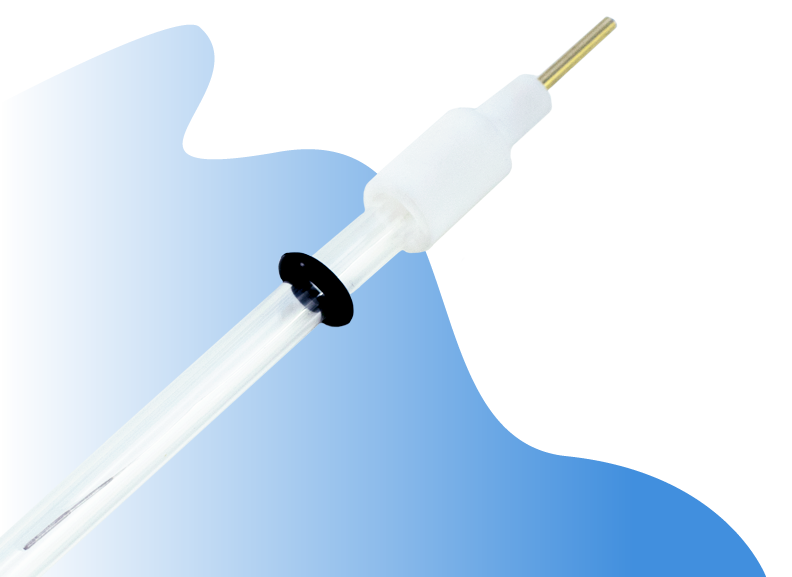
Like other types of voltammetry, cyclic voltammetry uses a three-electrode system consisting of a working electrode, a reference electrode, and a counter electrode.
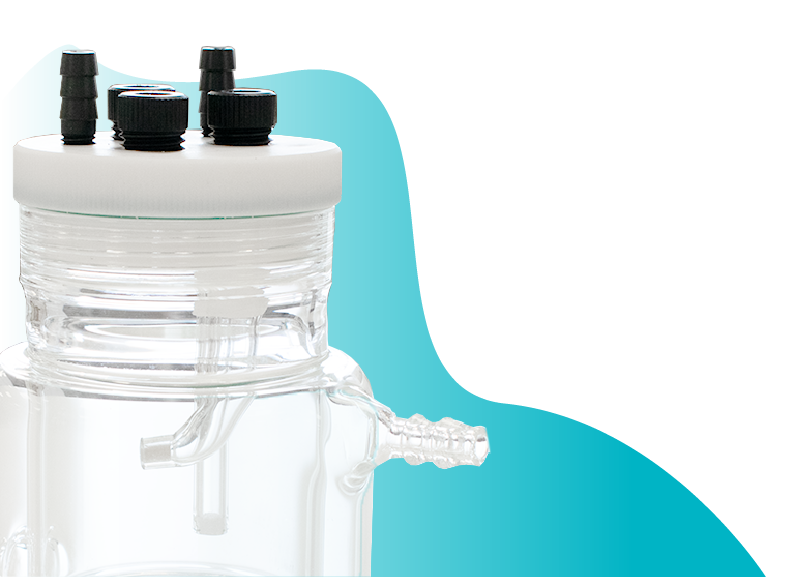
To perform cyclic voltammetry, you need to start by adding your electrolyte solution to an electrochemical cell, along with a reference solution and the three electrodes. After this, use a potentiostat to linearly sweep the potential between the working and reference electrodes. When the potentiostat reaches the pre-set limit, it will sweep back in the opposite direction.
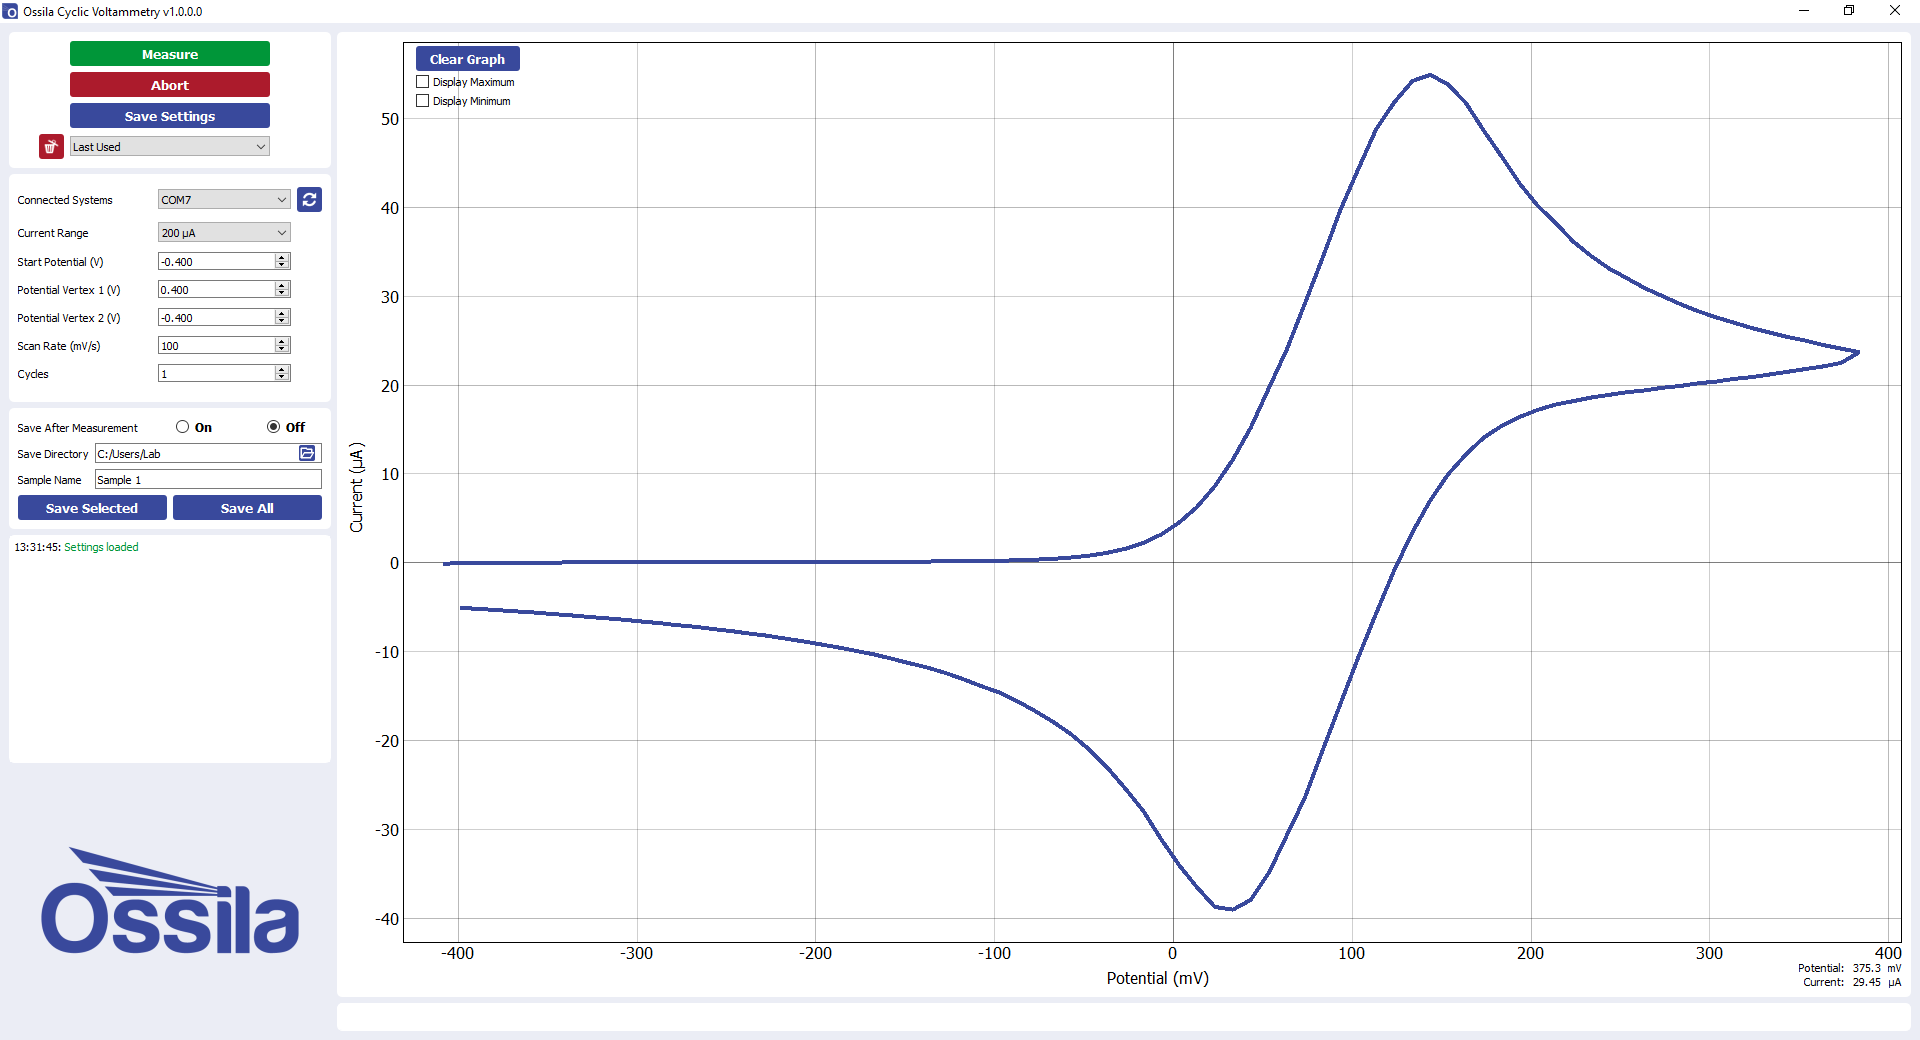
The potentiostat will repeat this process multiple times during a scan. While doing so, it will record the changing current between the working and counter probes. The result is a characteristic duck-shaped plot known as a cyclic voltammogram.
Basic Theory and Principles
Cyclic voltammetry is a sophisticated potentiometric and voltammetric method. During a scan, the chemical either loses an electron (oxidation) or gains an electron (reduction). This will depend on the direction of the ramping potential.
The Potentiometry Principle
Potentiometry is a way of measuring the electrical potential of an electrochemical cell under static conditions (i.e. no current flow).
For a general reduction or oxidation (redox) reaction, the standard potential is related to the concentration of the reactants (A) and the products (B). This occurs at the electrode/solution interface and can be recognised according to the Nernst equation:


Here, E is the electrode potential, E0′ is the formal potential, R is the gas constant (8.3145 J·K-1·mol-1), T is temperature, n is the number of moles of electrons involved and F is the Faraday constant (96,485 C·mol-1).
The term [B]b/[A]a is the ratio of products to reactants, raised to their respective stoichiometric powers. You can use this in place of an activity term when the concentration is sufficiently low (< 0.1 mol·dm˗3).
Under standard conditions of temperature and pressure, the Nernst equation can be written as:

Introduction to Voltammetry
Voltammetry is any technique that involves measuring the current while varying the potential between two electrodes. Voltammetric methods include cyclic voltammetry and linear sweep voltammetry, as well as similar electrochemical techniques such as staircase voltammetry, squarewave voltammetry, and fast-scan cyclic voltammetry.
In voltammetry, the current is generated by electron transfer between the redox species and the two electrodes. The diffusion and migration of ions carries this current through the solution.
The Three Electrode System
In principle, cyclic voltammetry (and other types of voltammetry) only requires two electrodes. However, in practice it is difficult to keep a constant potential while measuring the resistance between the working electrode and the solution. This is made more difficult as you try to pass the necessary current while also passing current to counteract the redox events at the working electrode.
It is the three-electrode system that separates the role of referencing the potential applied from the role of balancing the current produced.

To measure and control the potential difference applied, the potentiostat varies the potential of the working electrode while the potential of reference electrode remains fixed by an electrochemical redox reaction with a well-defined value.
To keep the potential fixed, the reference electrode must contain constant concentrations of each component of the reaction, such as a silver wire, and a saturated solution of silver ions.
To remove the risk of contamination, it is sometimes recommended to set up the electrochemical cell inside a glove box.
It is important to note that minimal current passes between the reference and the working electrodes. The current observed at the working electrode is completely balanced by the current passing at the counter electrode, which has a much larger surface area.
The electron transfer between the redox species at the working electrode and counter electrode generates current that is carried through the solution by the diffusion of ions. This forms a capacitive electrical double layer at the surface of the electrode called the diffuse double layer (DDL). The DDL is composed of ions and orientated electric dipoles that serve to counteract the charge on the electrode.
The current response that you measure will be dependent on the concentration of the redox species (the analyte) at the working electrode surface. You can explain this by using a combination of Faraday’s law and Fick’s first law of diffusion:

Where id is the diffusion-limited current, A is the electrode area, D0 is the diffusion coefficient of the analyte and (∂C0/∂x0) is concentration gradient at the electrode surface.
The product of the diffusion coefficient and concentration gradient can be thought of as the molar flux (mol·cm-2·s-1) of analyte to the electrode surface.
Cyclic Voltammograms Explained
A cyclic voltammogram is the ‘duck-shaped’ plot generated by cyclic voltammetry.
In the example cyclic voltammogram above, the scan starts at -0.4V and sweeps forward to more positive, oxidative potentials. Initially the potential is not sufficient to oxidise the analyte (a).
As the potential approaches several kT of the standard potential, the onset (Eonset) of oxidation is reached. Following this, the current exponentially increases (b) as the analyte begins its oxidation at the working electrode surface. For a reversible process, here the current rises initially as if there is no change in the concentration of oxidant. The current is dictated by the rate of diffusion of the oxidant to the electrode, as well as the proportion converted to the reduced form. This can be understood according to the Nernst equation. Gradually, as the scan continues, more oxidant is depleted. The concentration gradient adjusts to this. It is this change which causes a peak in the voltammogram. You can see how the decrease in current from depletion of the oxidant outweighs the increase from changing the proportion of oxidant oxidised at the electrode.
The current reaches peak maximum at point c (anodic peak current (ipa) for oxidation at the anodic peak potential (Epa). Here, more positive potentials cause an increase in current that is offset by a decreasing flux of analyte from further and further distance from the electrode surface.
From this point the current is limited by the mass transport of analyte from the bulk to the DDL interface, which is slow on the electrochemical timescale. This results in a decrease in current (d), as the potentials are scanned more positive. This occurs until a steady-state is reached where further increases in potential no longer has an effect.
Scan reversal to negative potentials (reductive scan) continues to oxidise the analyte. This continues until the applied potential reaches the value where the oxidised analyte (which has accumulated at the electrode surface) can be re-reduced (e).
The process for reduction mirrors that for the oxidation. The only difference is that it occurs with an opposite scan direction and a cathodic peak (ipc) at the cathodic peak potential (Epc) (f). The anodic and cathodic peak currents should be of equal magnitude but with opposite sign. This is only provided that the process is reversible (and if the cathodic peak is measured relative to the base line after the anodic peak).
The Randles-Sevcik equation
The peak current, ip, of the reversible redox process is described by the Randles-Sevcik equation.[1]
At 298 K, the Randles-Sevcik equation is:

Where n is the number of electrons, A the electrode area (cm2), C the concentration (mol·cm-3), D the diffusion coefficient (cm2·s-1), and v the potential scan rate (V·s-1).
Cyclic Voltammetry of Ferrocene
Ferrocene (Fc) is a common internal standard for cyclic voltammetry. Its cyclic voltammogram can therefore be considered "typical". Like the general case which was described above, at the start of a cyclic voltammetry scan a positively ramping potential (the forward sweep) is applied between the working and reference electrodes. As the potential increases, ferrocene (Fc) physically close to the working electrode is oxidised (i.e. loses an electron). This converts it to Fc+, and the movement of the electrons creates a measurable electrical current.
As un-reacted Fc diffuses to the electrode and continues the oxidation process, the electrical current is increased and there is a build up of Fc+ at the electrode. This build up of Fc+ and depletion of Fc is called the the diffusion layer, and effects the rate at which un-reacted material can reach to the electrode. Once the diffusion layers reaches a certain size, the diffusion of Fc to the electrode slows down, resulting in a decrease in the oxidation rate and thus a decrease in electrical current.

When the potential ramp switches direction, the process reverses and the reverse sweep begins. Fc+ close to the working electrode reduces (i.e., gains an electron), converting it back to Fc. The electrical current flows in the opposite direction, creating a negative current. The Fc+ diffuses to the electrode, reducing to Fc and resulting in a increase in the negative current.
Potentiostat

Keep Reading...
Cyclic voltammetry is a versatile electrochemical method with a range of different applications.
Read more... Getting Started with the Ossila Potentiostat
The Ossila Potentiostat has been designed to make it quick and easy to perform electrochemistry.
Read more...Contributing Authors
Written by
Software Engineer
PhD Student Collaborator
Product Expert
References
- Sevćik, A. Collection of Czechoslovak Chemical Communications 1958, 13, 349
- A. L. Bard and L. Faulkner Electrochemical methods: Fundamentals and Applications, 2nd ed. John Wiley & Sons 2001
- W. L. G. Armarego and C. L. L. Chai Purification of Laboratory Chemicals, 7th ed. Butterworth-Heinemann 2012


