Spectroscopy
Spectroscopy is the study of the interaction between a radiative energy and matter. This can refer to a range of different techniques, including:
- UV-vis or optical spectroscopy
- Fluorescence spectroscopy
- Raman spectroscopy
- Mass spectroscopy
Radiative energy is recorded using a spectrometer, or a detector within a spectrofluorometer, after it interacts with or is emitted by the sample material. The information is presented as a spectrum, showing intensity of the radiation as a function of energy, frequency, or wavelength. This can reveal important material properties, including physical or chemical structure, composition, and concentration.
The most widely studied type of radiative energy is optical spectroscopy, which studies material interaction with light within the UV, visible, and IR regions (often between 200-1000 nm). Depending on the experimental setup, spectroscopic techniques can measure absorption, transmission, reflectivity, photoluminescence and fluorescence, and more. At Ossila, we have a wide range of spectroscopy equipment to help you conduct a wide range of optical spectroscopy experiments.
Jump to: USB Spectroscopy Equipment | Resources | Technical Support


Monochromator
Coming Autumn 2025
Precise and reliable wavelength selection for your spectroscopy experiments.
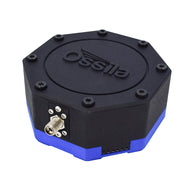
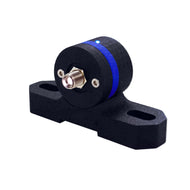
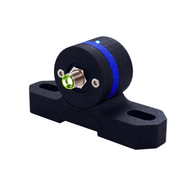
The Ossila Monochromator is a compact and reliable instrument that can easily integrate into many optical setups. Choose a specific excitation wavelength for fluorescence measurements, isolate and measure specific emission signals, or simply improve the sensitivity and accuracy of absorbance measurements with just the touch of a button.
With free software, you can easily select specific wavelengths between 380 – 1000 nm with <1 nm accuracy and quickly measure across this spectral range with scanning rates of up to 1000 nm/s.
USB Spectroscopy Equipment
Compact and cost-effective, the Ossila USB Spectrometer integrates seamlessly into any lab setup. Compatible with a range of USB equipment and accessories, you can customize your optical spectroscopy setup to meet your specific research needs.
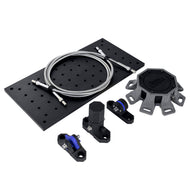


Browse all USB spectroscopy equipment
Resources
Buying Guides
Why Choose a Modular Spectrometer?
Spectrometers (or spectrophotometers) often come in large integrated systems with all components housed in one unit. These have high accuracies and are useful for taking repeat standard measurements – but they also have a large lab footprint and are expensive. These systems are useful for routine measurements, such as monitoring bacterial culture growth, checking sample purity or for very simple characterization of materials.
Read more... What is a Spectrometer? Types and Uses
A spectrometer is a device that measures a continuous, non-discrete physical characteristic by first separating it into a spectrum of its constituent components.
Read more... Do You Need a Sample Holder?
A spectrometer is a device that measures a continuous, non-discrete physical characteristic by first separating it into a spectrum of its constituent components.
Read more... Which Light Source Do You Need?
A spectrometer is a device that measures a continuous, non-discrete physical characteristic by first separating it into a spectrum of its constituent components.
Read more...Applications
 Spectrometer Optics
Spectrometers can be designed and built using a number of different optical configurations. Careful choice of components and configuration can avoid aberrations, which result in distorted or blurred spectra.
Read more... UV-Vis Spectroscopy Troubleshooting
It can be incredibly frustrating if you encounter a problem while performing UV-Vis spectroscopy, and usually causes an unnecessary delay.
Read more... UV-Vis Spectroscopy Errors
Like any analytical technique, spectrometers are subject to error, including dark noise, stray light, and spectral bandwidth.
Read more... Python for Spectroscopy: Spectra Data Visualization
Optical spectroscopy data can be processed faster and more consistently using programming tools such as Python. This is a step-by-step guide of how researchers process multiple spectra that were taken using the Ossila Optical Spectrometer. The code in this guide is designed for the Ossila Optical Spectrometer.
Read more... Thin Film Spectroscopy: Setup and Measurement
This article contains some advice from our researchers that should help you get started taking optical spectroscopy measurements of thin films.
Read more... Measuring Thin Film Fluorescence
To measure the fluorescence of a thin film, you will need an optical spectrometer, a fixed sample holder and a high energy light source (such as a UV laser or the Ossila UV light source). We also recommend using optical fiber cables between modular elements to reduce the attenuation of your signal.
Read more...The different types of spectroscopy can be categorized by either the application it is used for or by type of radiative energy employed. The application of spectroscopic methods in organic (carbon-based) chemistry and organic electronics is known as organic spectroscopy.
Read more...Theory and Techniques
 Absorption Spectroscopy
In absorption spectroscopy, the intensity of light absorbed by a sample is measured as a function of wavelength. This can provide important information about the electronic structure of an atom or molecule.
Read more... Photoluminescence Spectroscopy
Photoluminescence is luminescence resulting from photoexcitation. In other words, photoluminescence is when a material emits light following the absorption of energy from incident light from another light source.
Read more... Fluorescence Quenching and Non-Radiative Relaxation
Photoluminescence occurs when electrons relax from photoexcited states radiatively. Emissions resulting from singlet-singlet transitions are known as fluorescence. However, there are a number of ways in which electrons in these excited states can relax non-radiatively.
Read more... Thermally Activated Delayed Fluorescence (TADF)
Thermally Activated Delayed Fluorescence (TADF) is a mechanism by which triplet state electrons can be harvested to generate fluorescence.
Read more... Fluorescence and Phosphorescence
Both fluorescence and phosphorescence are types of photoluminescence. The main empirical difference between fluorescence and phosphorescence is the time in between absorbance and the emission of photons.
Read more... Electroluminescence
Electroluminescence (EL) is the generation of light through the radiative recombination of holes and electrons which have been injected into the material from cathode and anode contacts. The charge carriers are injected into the material due to an applied bias over the cathode and anode. These cathode and anodes are orientated opposite each other.
Read more... Exciplex and Excimer Absorption and Emission
An exciplex (or excited complex) is a complex formed between two different conjugated molecules (monomers), one of which is in an excited state.
Read more... Spectroelectrochemistry (SEC) Techniques
Spectroelectrochemistry (SEC) is an experimental technique that combines electrochemistry and spectroscopy. While electrochemical experiments provide information on macroscopic properties like reaction rates, spectroscopic techniques give information on a molecular level, such as the structure of molecules and their electronic configuration.
Read more... Jablonski Diagrams
Jablonski diagrams are the simplest way to the transitions between electronic and vibrational states. The representative energy levels are arranged with energy on the vertical axis and vary horizontally according to energy state multiplicity.
Read more... How Does a Spectrometer Work? Principles Explained
Optical spectrometers take light and separate it by wavelength to create a spectra which shows the relative intensity of each. This basic principle has a wide range of applications and uses.
Read more... What is Spectroscopy? Definition and Types
Spectroscopy refers to a range of techniques which are used to study the interaction between a radiative energy and matter.
Read more...Technical Support